External data analytics
| External data analytics, which is based on Grafana, is deprecated and will be removed. For new deployments, use the built-in account-based analytics feature. |
External data analytics surfaces Unblu Spark’s data and events in a self-hosted analytics stack. Setting it up involves deploying an OpenSearch or Elasticsearch cluster for storage and Grafana for visualization, then configuring Unblu Spark to connect to them.
External data analytics is primarily intended for use with the Unblu Cloud. To use it with an on-premises installation of Unblu Spark, contact the Unblu support team.
The Collaboration Server acts as an authentication proxy. Neither Grafana nor the OpenSearch or Elasticsearch cluster needs to be exposed to the internet.
External data analytics is accessible to Unblu users with the ADMIN role or higher. To grant users with the SUPERVISOR or REGISTERED_USER role access as well, enable com.unblu.analytics.grafana.allowAccessToAnalytics. If you enable it, all agents can access all the data in the Grafana dashboards, regardless of their team.
Access is read-only for all users, including admins. They can’t update data sources or dashboards. All dashboards are predefined in Unblu Spark and synchronized when an admin logs in to data analytics. If you need more dashboards, contact the Unblu support team.
Search cluster deployment
-
The easiest way to deploy an OpenSearch cluster is to use either a Helm chart or an operator.
-
To deploy an Elasticsearch cluster, you can use the Helm chart provided by Elastic.
When your cluster is up and running, create a new user for it with permissions to create, read, and update indices.
Grafana deployment
Deploy a separate Grafana instance. You can configure it by providing a grafana.ini file on startup. For more information, refer to the Grafana documentation.
Configure the Grafana deployment to use the auth proxy authentication method. The table below describes the other required Grafana settings:
| Name | Description |
|---|---|
[auth.proxy] section |
|
|
Enables auth proxy authentication. |
|
Header used for authentication. Must be set to |
|
Defines which user property is passed in the |
|
Defines whether Grafana creates a new user if the one provided in the auth header doesn’t exist. Set to |
|
Encoding for non-ASCII characters in the auth header. Set to |
|
Set to |
|
Defines which user information Grafana extracts from auth headers. Must be set to |
[users] section |
|
|
Allows users to sign up manually. Set to |
|
If |
|
Sets the default role for new users. Set to |
[server] section |
|
|
Set to the root URL of the Collaboration Server including the protocol but without a trailing slash. |
|
Set to the root URL of the Collaboration Server including the protocol, followed by the Grafana auth proxy path with a trailing slash. |
[live] section |
|
|
Set to |
Your grafana.ini file should end up looking similar to the example below:
grafana.ini config file
[snapshots]
external_snapshot_url = https://my-unblu-deployment-domain.com/app/grafana (1)
external_snapshot_name = Send to Unblu
[auth.proxy]
enabled: true
header_name: X-WEBAUTH-USER
header_property: username
auto_sign_up: false
enable_login_token: false
headers: "Name:X-WEBAUTH-NAME Email:X-WEBAUTH-EMAIL Role:X-WEBAUTH-ROLE"
[users]
allow_sign_up: false
auto_assign_org: true
auto_assign_org_role: Viewer
[server]
domain: https://my-unblu-deployment-domain.com (2)
root_url: https://my-unblu-deployment-domain.com/app/grafana/ (3)
[live]
max_connections: 0| 1 | Only required if you use Grafana’s snapshot feature. Replace the URL with the appropriate value for your deployment. |
| 2 | Replace with the domain of your Unblu deployment. |
| 3 | Replace with the appropriate URL combining your Unblu deployment domain and the Grafana auth proxy path. |
Collaboration Server configuration
To enable external analytics in the Collaboration Server, set com.unblu.analytics.enabled to true.
Search engine configuration
First, specify the type of search engine in com.unblu.search.engine.type. The possible values are OPEN_SEARCH and ELASTIC_SEARCH. The default value is OPEN_SEARCH.
Depending on whether you use Elasticsearch or OpenSearch, you must set different configuration properties to configure the search engine:
-
If you use OpenSearch, the configuration properties are named
com.unblu.search.engine.os.*. -
If you use Elasticsearch, the configuration properties are named
com.unblu.search.engine.es.*.
In the table below, both keys are listed in the first column. Set the property appropriate for the type of search engine you deployed.
| Property name | Description |
|---|---|
|
com.unblu.search.engine.os.host com.unblu.search.engine.es.host |
URL of the search cluster, including the port, for example https://opensearch:9200. Defined during cluster deployment. |
|
com.unblu.search.engine.os.username com.unblu.search.engine.es.username |
The username of the user created in the search cluster. Must have permissions to create, read, and update indices. |
|
com.unblu.search.engine.os.password com.unblu.search.engine.es.password |
The password of the user created in the search cluster. |
The authentication type to use for the search cluster. For OpenSearch, the possible values are |
Three configuration properties are exclusive to Elasticsearch:
-
com.unblu.search.engine.es.token specifies the token to use when com.unblu.search.engine.es.authType is set to
TOKEN. -
com.unblu.search.engine.es.apikeyId and com.unblu.search.engine.es.apikeySecret specify the API key and secret, respectively, when com.unblu.search.engine.es.authType is set to
API_KEY.
Grafana configuration
The table below lists the configuration properties related to Grafana that you must set in the Collaboration Server.
Enables Grafana configuration. |
|
com.unblu.analytics.grafana.grafanaRootUrl |
The root URL of the Grafana deployment, for example |
com.unblu.analytics.grafana.grafanaAdminUser |
Username of the Grafana user used to manage users and organizations. Must have admin permissions. |
com.unblu.analytics.grafana.grafanaAdminPassword |
Password of the Grafana user. |
com.unblu.analytics.grafana.grafanaDataSourceName |
Name of the data source created in Grafana for each user, for example |
com.unblu.analytics.grafana.grafanaDataSourceUrl |
URL of the search cluster, for example |
com.unblu.analytics.grafana.grafanaDataSourceUsername |
Username of the OpenSearch or Elasticsearch user that Grafana accesses the search cluster with. Must have index read permissions. |
com.unblu.analytics.grafana.grafanaDataSourcePassword |
Password of the OpenSearch or Elasticsearch user that Grafana accesses the search cluster with. |
Enables access to external analytics from the user menu in the Account Configuration interface. Set to |
|
com.unblu.ui.usermenu.itemExternalAccountAnalytics |
The label of the menu item to access external analytics. The default value is Account analytics. |
-
Use com.unblu.analytics.grafana.dashboards to specify which dashboards are enabled.
-
To grant non-admin users access to Grafana, enable com.unblu.analytics.grafana.allowAccessToAnalytics.
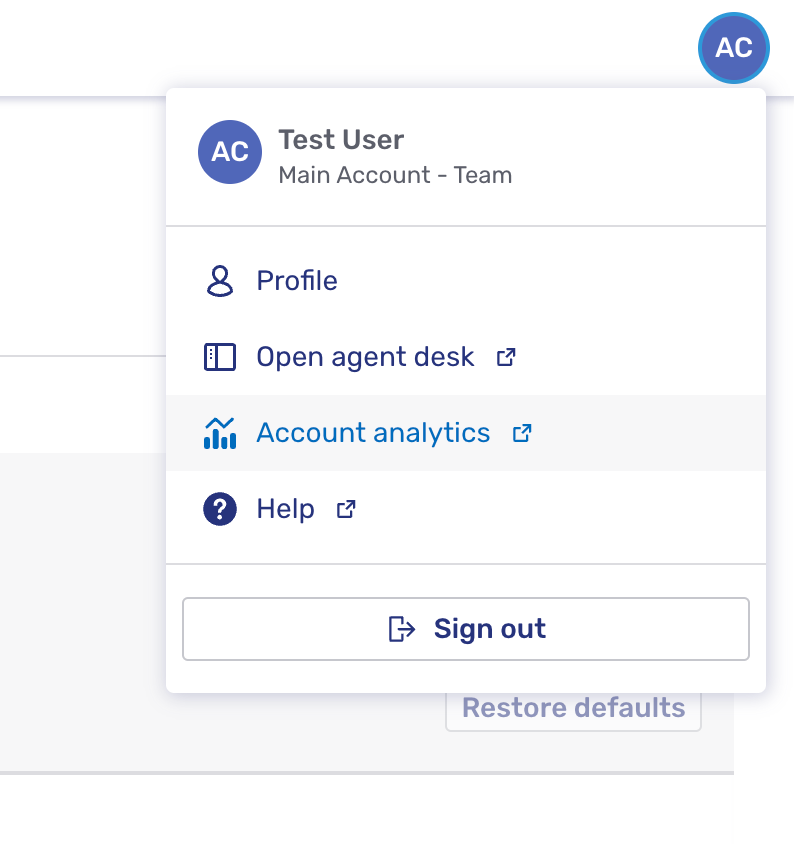
Accessing external data analytics
To access the analytics, open the Account Configuration interface and click your avatar in the upper right corner. This opens the user menu. In the menu, click Account analytics to open Grafana.
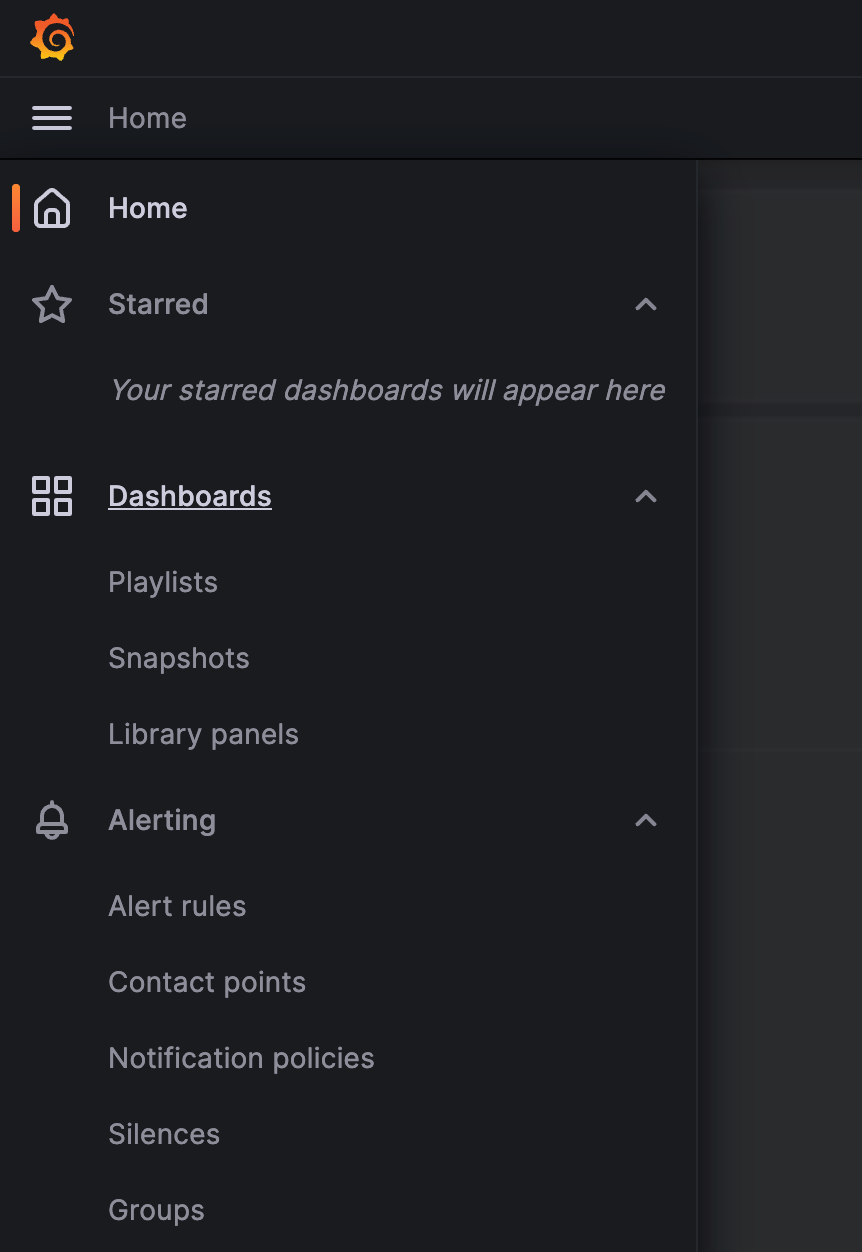
You can now access the dashboards through the hamburger menu  in the top-left corner:
See also
-
For an overview of Unblu’s analytics offering, refer to Introduction to Unblu analytics.
-
For information on the built-in account-based analytics feature, refer to Setting up account-based analytics.
-
For more information on OpenSearch, refer to the OpenSearch documentation.
-
For more information on Elasticsearch, refer to the Elasticsearch documentation.
-
For more information on Grafana, refer to the Grafana documentation.